
Over the last five years, organizations have undergone vast digital change — from the rapid rollout of remote-working capabilities to full migration from on-premises to cloud-based operations.
According to Flexera’s 2023 State of the Cloud Report, a majority of organizations (88%) have adopted a multi-cloud approach, using a mix of public, private and hybrid cloud environments.
These changes have created highly distributed and fragmented IT architectures that are challenging for cybersecurity teams to secure and monitor.
Their ability to manage and protect the business’s critical and sensitive information — including customer and employee personal data (PII), intellectual property and company secrets — depends on having visibility across all parts of the company’s network and cloud environments.
What is Data Visualization?
Data visualization is a form of data analysis that presents its findings using charts, diagrams, infographics and other representations to help identify trends and data-driven insights in a meaningful way. It helps simplify the process of identifying complex patterns and relationships within vast stores of data.
Cutting through the noise
When it comes to PII and other sensitive data types, data visualization can help organizations identify areas of risk within their environments, enabling them to mitigate and protect that data effectively.
This is crucial for cybersecurity teams, as well as compliance and data protection teams, working to secure and protect sensitive data.
Enterprise Recon provides organizations visibility into the data they have wherever it is stored within their environments, whether on-premises or in the cloud. After delivering rapid, accurate discovery scanning for pre-defined and custom data types, it presents a findings dashboard showing a graphical plot of data matches with a summary table, filterable by location/targets.
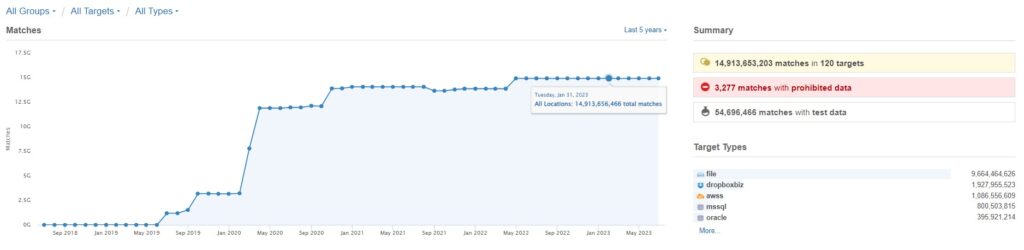
Enterprise Recon data discovery "matches" dashboard and summary
Alongside this, simple charts illustrate compliance/noncompliance status for groups and targets.
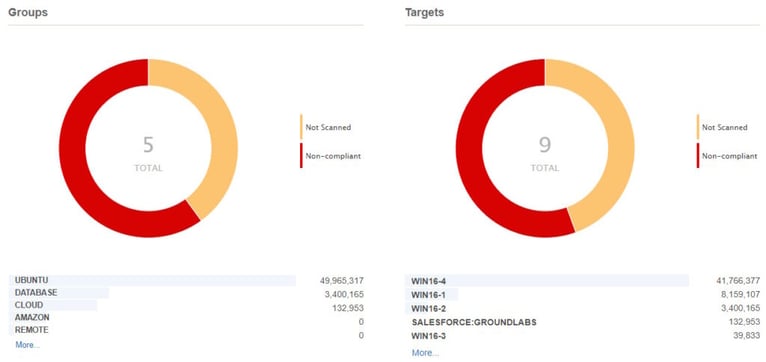
Enterprise Recon data discovery group/target compliance status dashboard
Data Visualization for risk profiling and advanced analytics
Simple snapshots analyzing the data across an organization gives cybersecurity teams the ability to target and remediate rogue data stores. However, more advanced analytics, such as risk profiling of data types, offers businesses the insight to inform their wider data security strategy and better manage their overall data security risk.
The Pro edition of Enterprise Recon offers this feature including a risk over time analysis showing how data management approaches have impacted the organizations data risk profile.
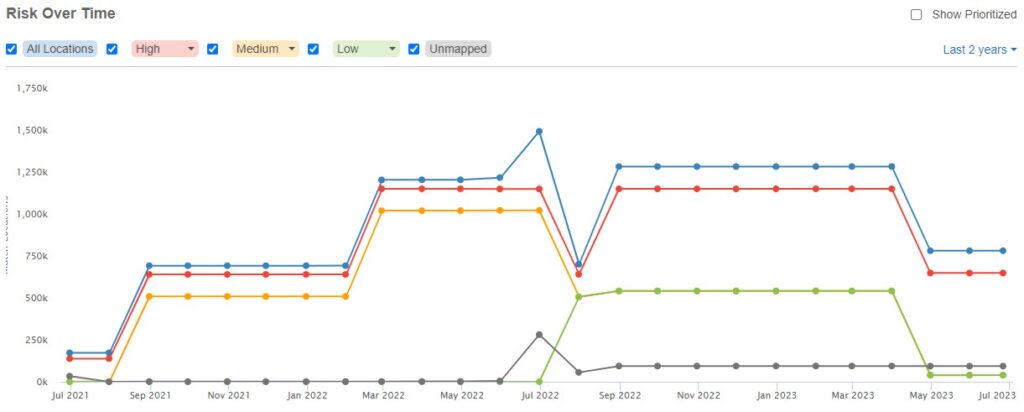
Enterprise Recon data risk over time dashboard
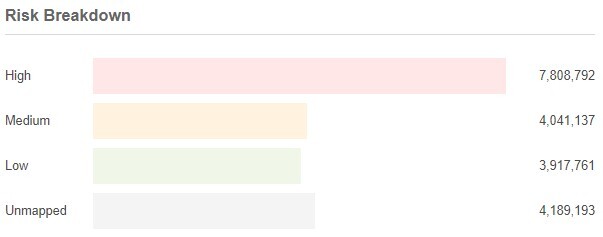
Enterprise Recon data risk profiling dashboard
Integration with other advanced analytics and business intelligence tools, such as PowerBI, Tableau and SAP Crystal Reports, further enables organizations to monitor and review their data security within the context of other corporate risks and objectives.
To find out how Enterprise Recon can help you cut through the noise, book a call with one of our experts today.


