Enterprise Recon 2.6.0
Dashboard
The Enterprise Recon Dashboard is a summary of the current and historical state of sensitive data discovered across your organization. To view the Dashboard, click on the Enterprise Recon edition logo in the top navigation menu.
The Dashboard is divided into two main sections that provide insight into your organization's
The Dashboard also provides quick access to start a new scan, or to download the Global Summary Report for the Master Server.
Sensitive Data Matches
You can find the following widgets in the sensitive data matches section of the Dashboard:
By default, all widgets display the match count information across all Target Groups, Targets, and/or Target types for the Master Server. You can customize the match information displayed in each widget using the available data filters below:

| Filter | Description |
|---|---|
| [Groups] | Only show the match count information for selected Target Groups. The default view includes the match count for "All Groups". |
| [Targets] | Only show the match count information for selected Targets. The default view includes the match count for "All Targets". |
| [Types] | Only show the match count information for selected Target types (e.g. local files, database etc). The default view includes the match count for "All Types". |
Matches
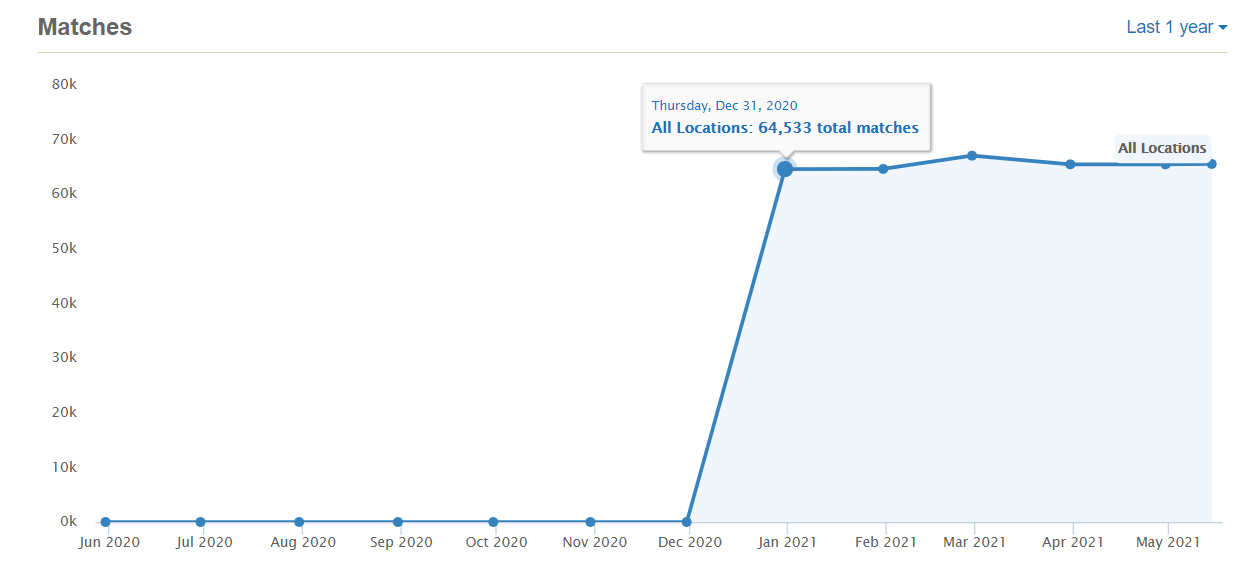
The Matches widget is a line chart that displays the match count history for selected Target Groups, Targets, and/or Target types over a specific time period. You can customize the match information displayed in the widget using the available data filter below:
| Filter | Description |
|---|---|
| [Time range] | Only show the match count information for the selected time range (e.g. past one year, past one month). The default view includes the match count over the "Last 1 year". |
Hovering over a data point shows the total match count for all selected locations on the given date.
Summary
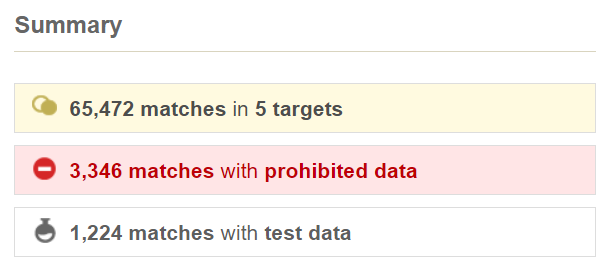
The Summary widget displays the current number of sensitive data matches across selected Target Groups, Targets, and/or Target types, with a breakdown by match severity.
Groups and Targets
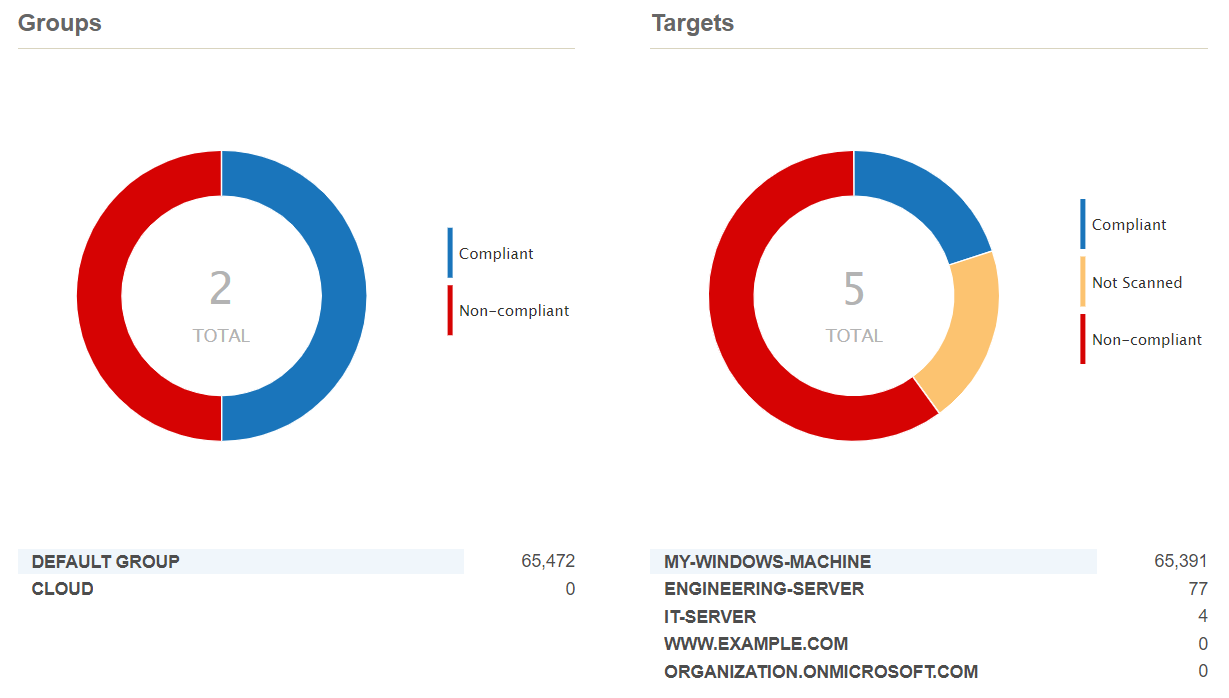
The Groups and Targets donut chart widgets display the breakdown for selected Target Groups and Targets by compliance status.
| Status | Groups Chart | Targets Chart |
|---|---|---|
| Compliant | All Targets in the Group have been (i) scanned with no sensitive data matches found, or (ii) scanned and all sensitive data matches have been fully remediated. | The Target has been (i) scanned with no sensitive data matches found, or (ii) scanned and all sensitive data matches have been fully remediated. |
| Non-compliant | At least one Target in the Group has been scanned and found to have at least one sensitive data match. | The Target has been scanned and found to have at least one sensitive data match. |
| Not Scanned | All Targets in the Group have not been scanned to-date. | The Target has not been scanned to-date. |
Target Types
The Target Types widget displays the current number of sensitive data matches across selected Target Groups, Targets, and/or Target types, with a breakdown by Target type.
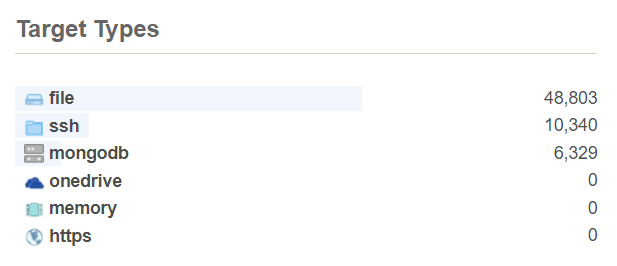
Clicking on a Target type (e.g. "mongodb") will take you to the Targets page, with a filtered list of Targets that contain the selected Target type.
File Formats
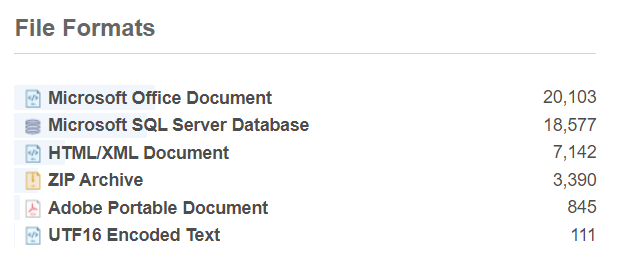
The File Formats widget displays the current number of sensitive data matches across selected Target Groups, Targets, and/or Target types, with a breakdown by file type or format.
Sensitive Data Risks PRO
You can find the following widgets in the sensitive data risks section of the Dashboard:
See Risk Scoring and Labeling for more information.
Risk Over Time
The Risk Over Time widget is a multi line graph that displays the risk trend and history over a specific time period for Targets associated with the Master Server.
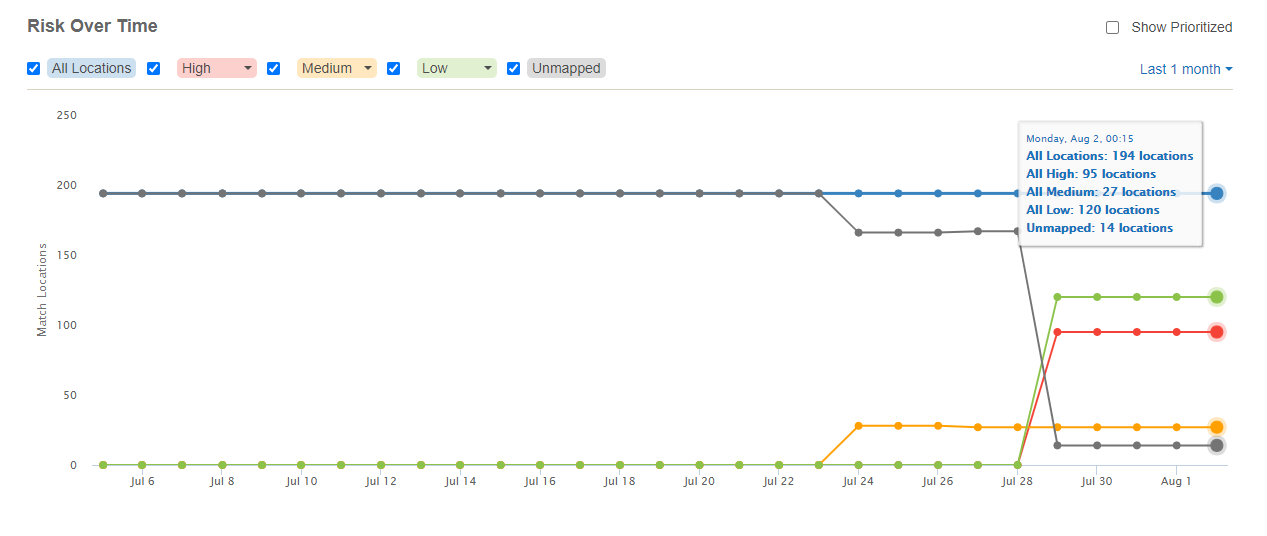
Each line graph represents the number of match locations that are
- Mapped to risk profiles with a specific risk level (e.g. "High", "Medium", "Low"), and
- Not mapped to any risk profile at all (e.g. "Unmapped").
ER2 records and updates the total number of match locations across all Targets once a day (at the end of the day). The most recent data point displayed in the widget is always for the prior day; any changes to the total number of match locations resulting from remediation, new scans, and/or deletion of Targets will only be reflected in the corresponding data points the following day. However, changes made to a risk profile (e.g. changes to the risk level, risk profile priority, or deletion of risk profiles) will be reflected for the corresponding match locations in real-time across all available data points.
You can customize the historical risk information displayed in the widget using the available options and data filters below:
| Filter | Description |
|---|---|
| All Locations | Select the checkbox to show the risk trend and risk history information for all match locations. This includes locations mapped to risk profiles with any risk level (e.g. "High", "Medium", "Low"), and locations that are not mapped to any risk profile (e.g. "Unmapped"). |
| High | Select the checkbox to show the count of match locations mapped to risk profiles with "High" risk levels. |
| Medium | Select the checkbox to show the count of match locations mapped to risk profiles with "Medium" risk levels. |
| Low | Select the checkbox to show the count of match locations mapped to risk profiles with "Low" risk levels. |
| Unmapped | Select the checkbox to show the count of match locations that are not mapped to any risk profile. |
| Show Prioritized | Select the checkbox to show the count of match locations only for the highest priority matching risk profile. This setting applies to the Risk Over Time, Top 3 Targets, and Risk Breakdown widget. See How It Works for more information. |
| [Time range] | Only show the risk trend and risk history information for the selected time range (e.g. past one year, past one month). The default view includes the match count over the "Last 1 year". |
How It Works
Match location A is mapped to three risk profiles:
| Profile Name | Risk Level | Priority |
|---|---|---|
| Risk-Profile-1 | Medium | 1 |
| Risk-Profile-2 | High | 2 |
| Risk-Profile-3 | Medium | 3 |
Location A is counted twice for the "Medium" line graph, and counted once for the "High" line graph in the Risk Over Time widget.
If the Show Prioritized checkbox is selected, Location A will only contribute one count towards the Risk Over Time widget in the "Medium" line graph. This corresponds to the risk level for "Risk-Profile-1", the highest priority matching risk profile for Location A.
Top 3 Targets
The Top 3 Targets widget displays the top three Targets with the highest number of locations mapped to at least one risk profile, with a breakdown by risk level.
You can view the top three Targets for other risk levels by changing the risk level selector at the top right corner of the widget, and select the Show Prioritized option to show the count of match locations only for the highest priority matching risk profile.
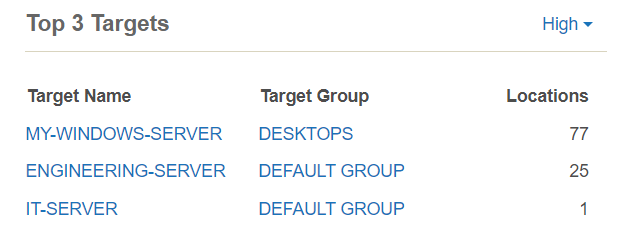
Clicking on a Target / Target Group will take you to the Investigate page, with a filtered list of match locations corresponding to the selected Target(s) and risk level.
Risk Breakdown
The Risk Breakdown widget displays the current number of sensitive data locations that are:
- Mapped to risk profiles with a specific risk level (e.g. "High", "Medium", "Low"), and
- Not mapped to any risk profile at all (e.g. "Unmapped").
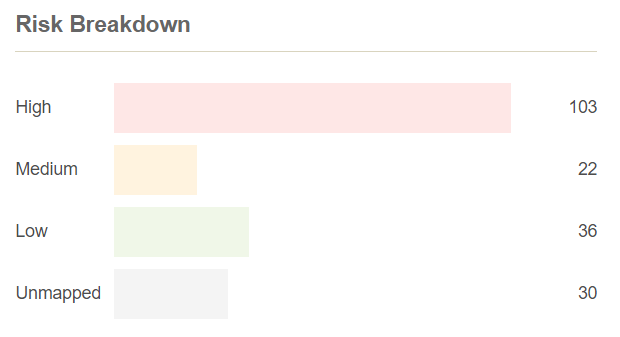
You can select the Show Prioritized option to show the count of match locations only for the highest priority matching risk profile.
PRO This feature is only available in Enterprise Recon PRO Edition. To find out more about upgrading your ER2 license, please contact Ground Labs Licensing. See Subscription License for more information.